
SEAG Scoring System
Understanding SEAG Results
After completing the SEAG assessment, each pupil receives their results in a document called the Statement of Outcome. This report provides a breakdown of scores to help parents and pupils understand performance across both English and Maths, as well as how that performance compares with other candidates.
English Standardised Age Score (SAS)
The English SAS reflects a pupil’s overall performance in English across both test papers.Based on a total of 56 questions 44 multiple-choice questions and 12 written (open-ended) responses. Score range: 69 to 141 and Average (mean): 100. This score is standardised for age, meaning it fairly compares pupils of different ages within the same year group. A score of 100 represents the average performance, while scores above or below indicate performance relative to that average.
Maths Standardised Age Score (SAS)
The Maths SAS measures performance in Maths across both test papers. Based on a total of 56 questions 44 multiple-choice questions and 12 written (open-ended) responses. Score range: 69 to 141 and Average (mean): 100. Like the English score, this is also age-standardised, ensuring a fair comparison between pupils.
Total Standardised Age Score (TSAS)
The Total Standardised Age Score (TSAS) is the combined score from both subjects. Calculated as: English SAS + Maths SAS. Score range: 138 to 282 and Average (mean): 200. This total score is often used by schools as a key indicator when assessing overall academic performance.
Cohort Percentile Ranking (CPR)
The Cohort Percentile Ranking (CPR) shows how a pupil performed in comparison to all other pupils who took the SEAG assessment. A percentile tells you the percentage of pupils your child scored higher than. For example:58% means the pupil performed better than 58% of candidates. The CPR helps parents understand relative performance, not just raw scores.The exact CPR is only provided for pupils in Bands 2–4.This gives a clearer idea of how close a pupil may be to moving into a higher band.
Score Bands
Pupils are grouped into score bands based on their percentile ranking. These bands are often used by schools during the admissions process.
Band Breakdown
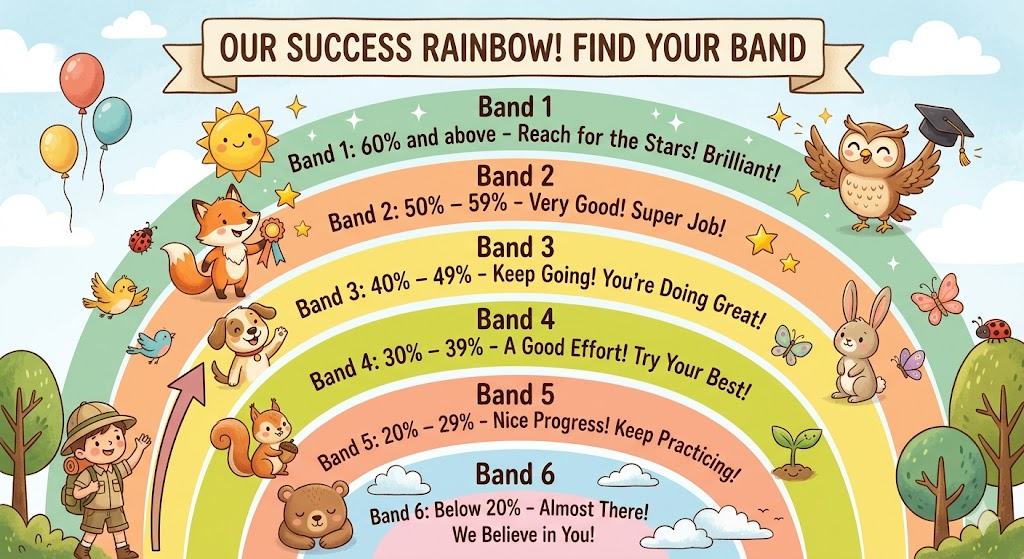
What Do the Bands Mean?
The bands provide a simple way to understand how a pupil performed compared to others. For example:Band 1 pupils are in the top 40% of all candidates and Lower bands indicate a lower relative position within the overall cohort.Schools may use these bands, along with scores, to help determine admissions decisions.
Worried about your child’s SEAG preparation?
We provide step-by-step guidance to help them stay on track and perform their best.